1
Context
Supply & Demand
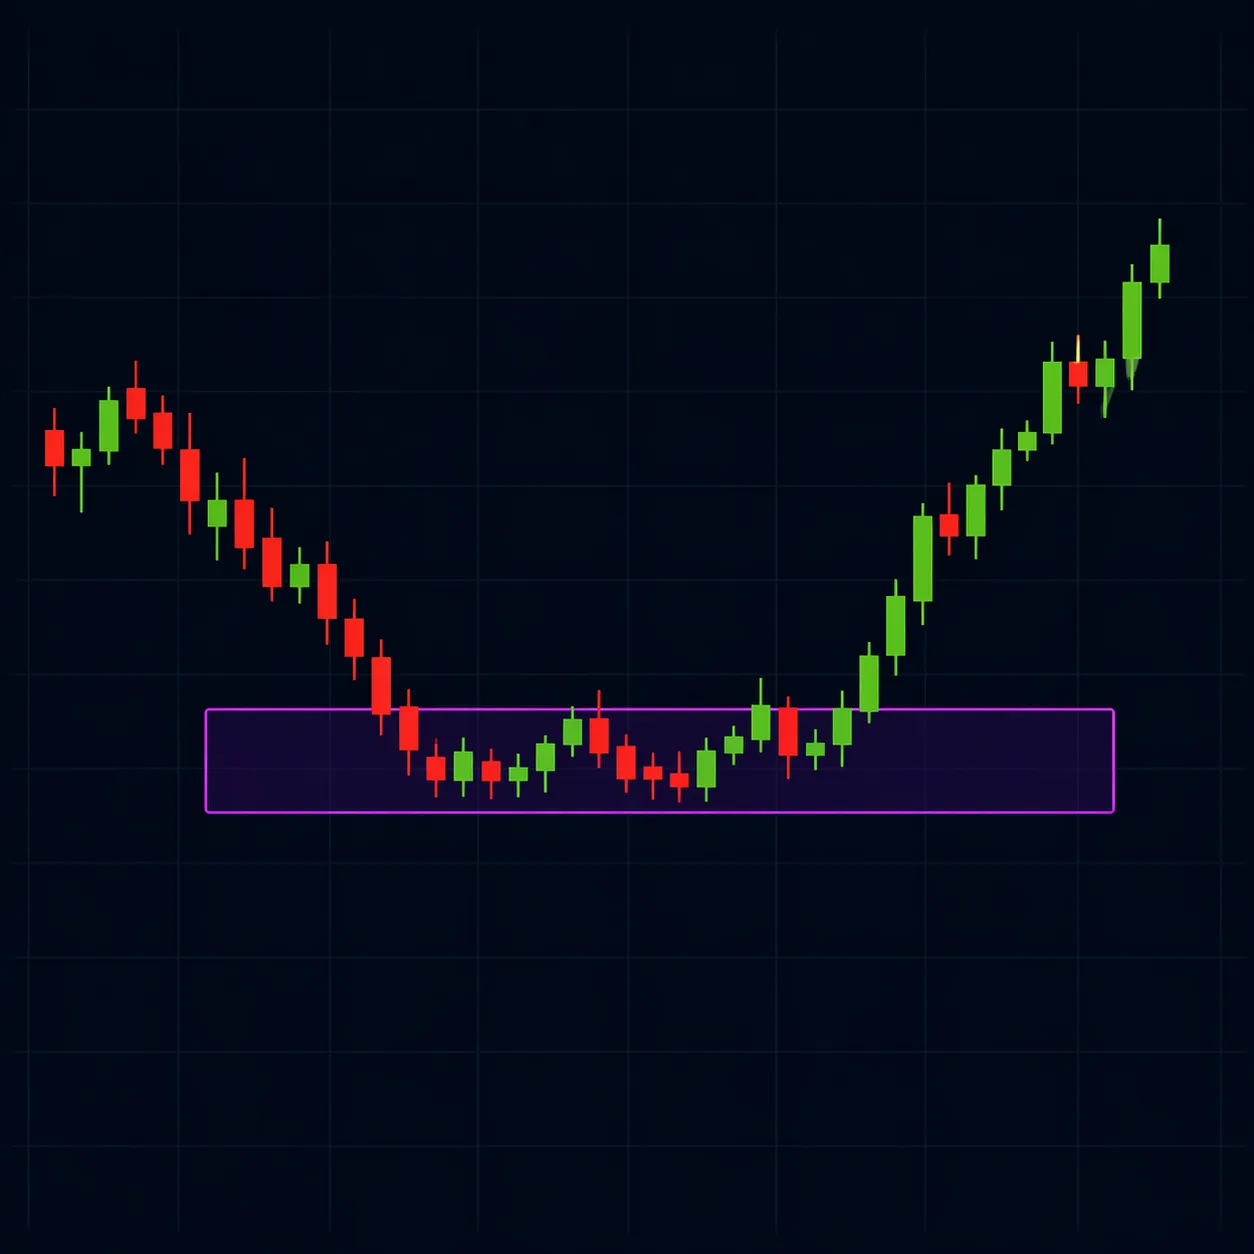
Price is trading into a strong demand zone on the higher timeframe.
Buyers are likely to defend this area.
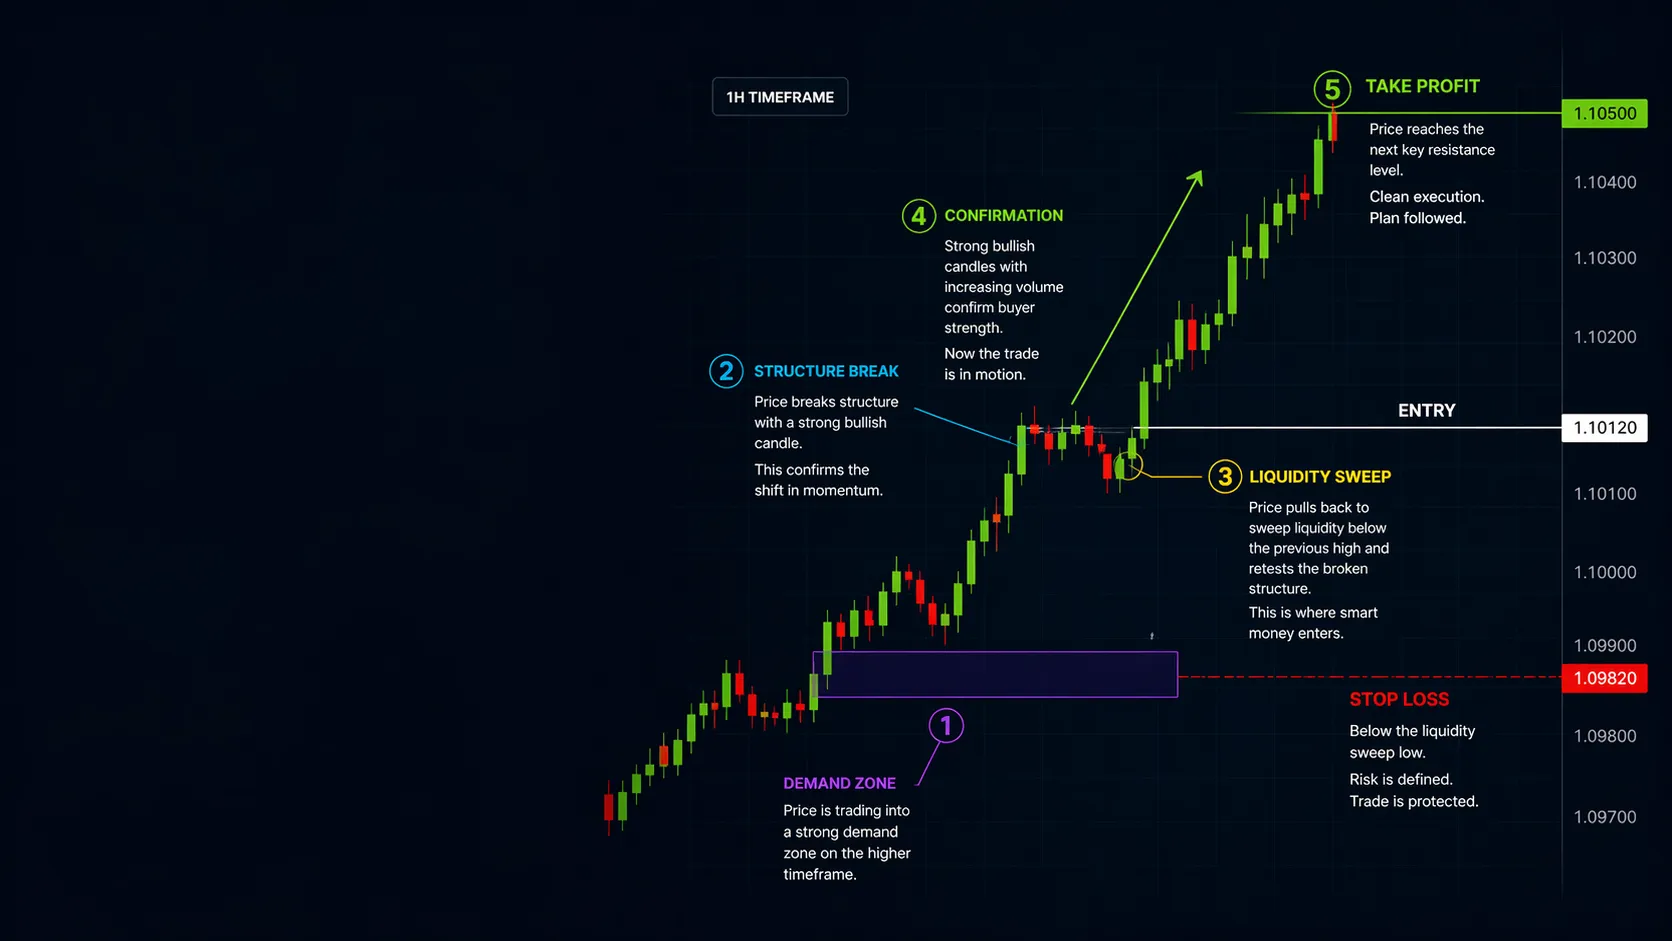
Below is a real example of a high-probability trade from start to finish — using the 5 essentials you just learned.
Start Your Journal (30 Seconds) →Supply & Demand
Price is trading into a strong demand zone on the higher timeframe.
Buyers are likely to defend this area.
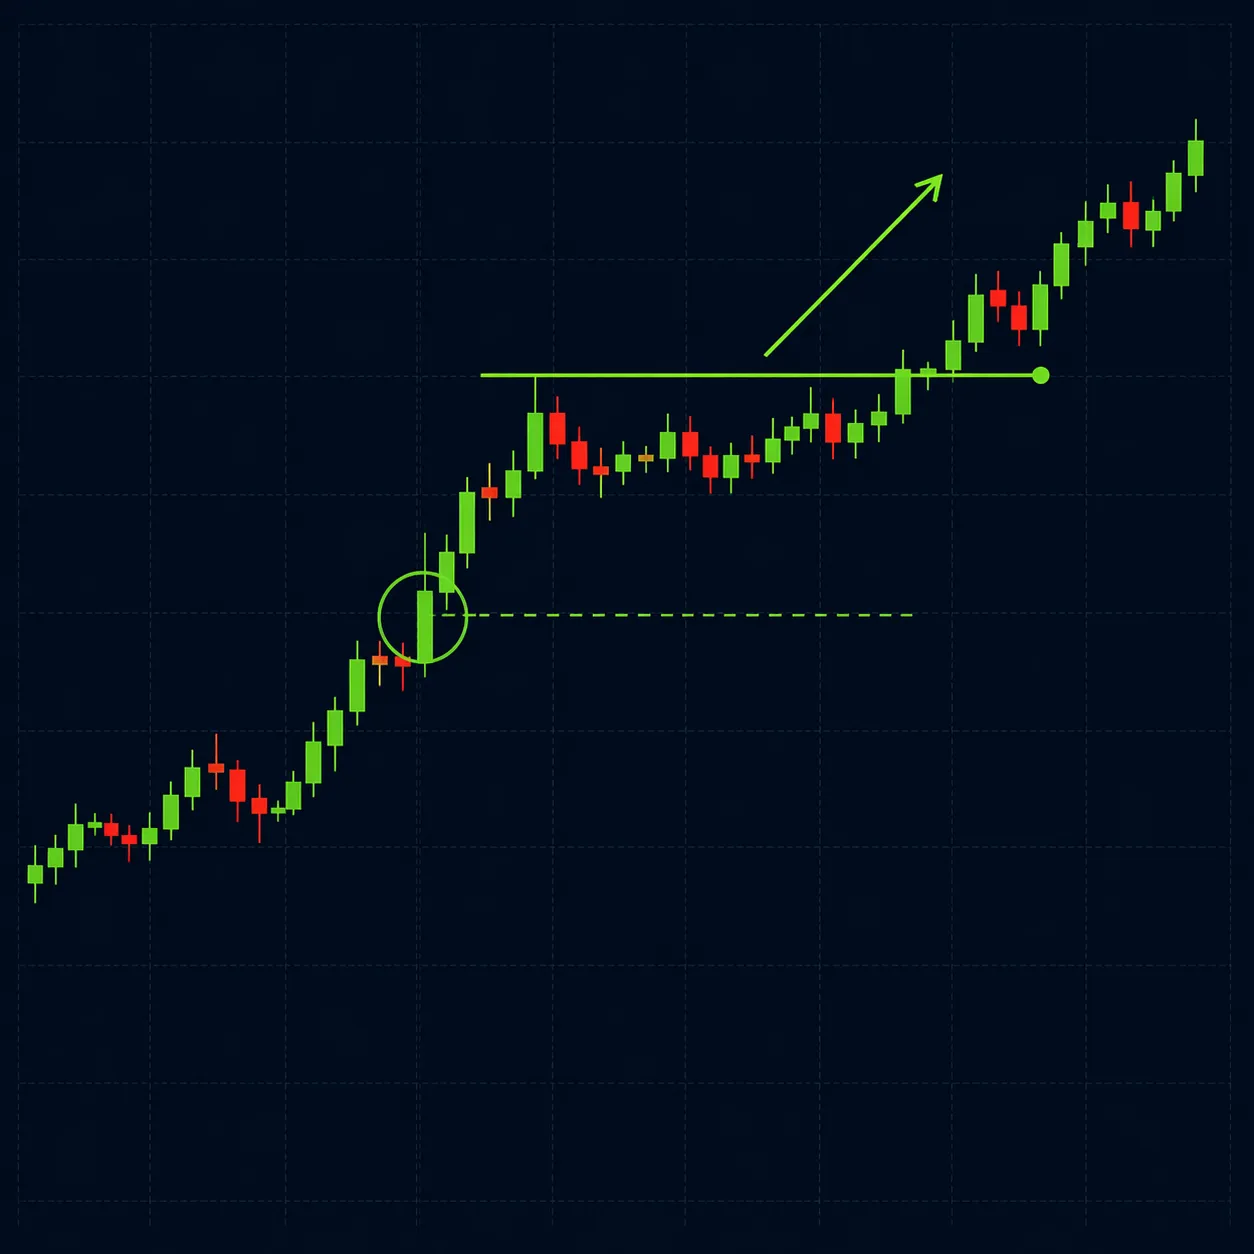
Market Structure
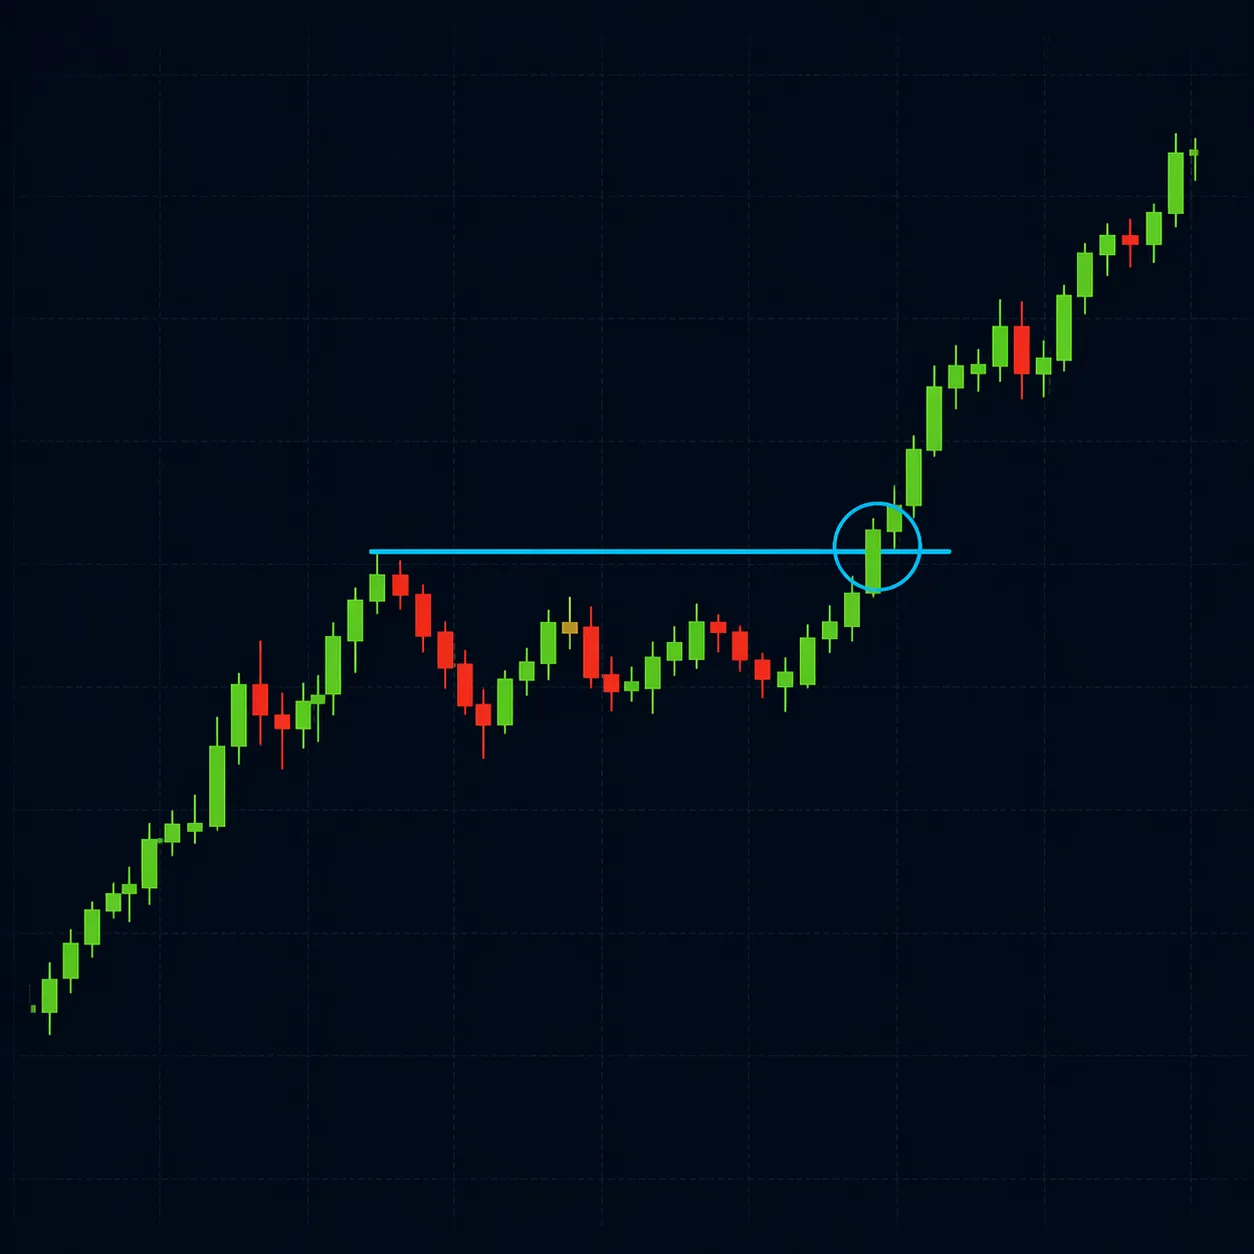
Price breaks structure with a strong bullish candle.
This confirms the shift in momentum.
Liquidity
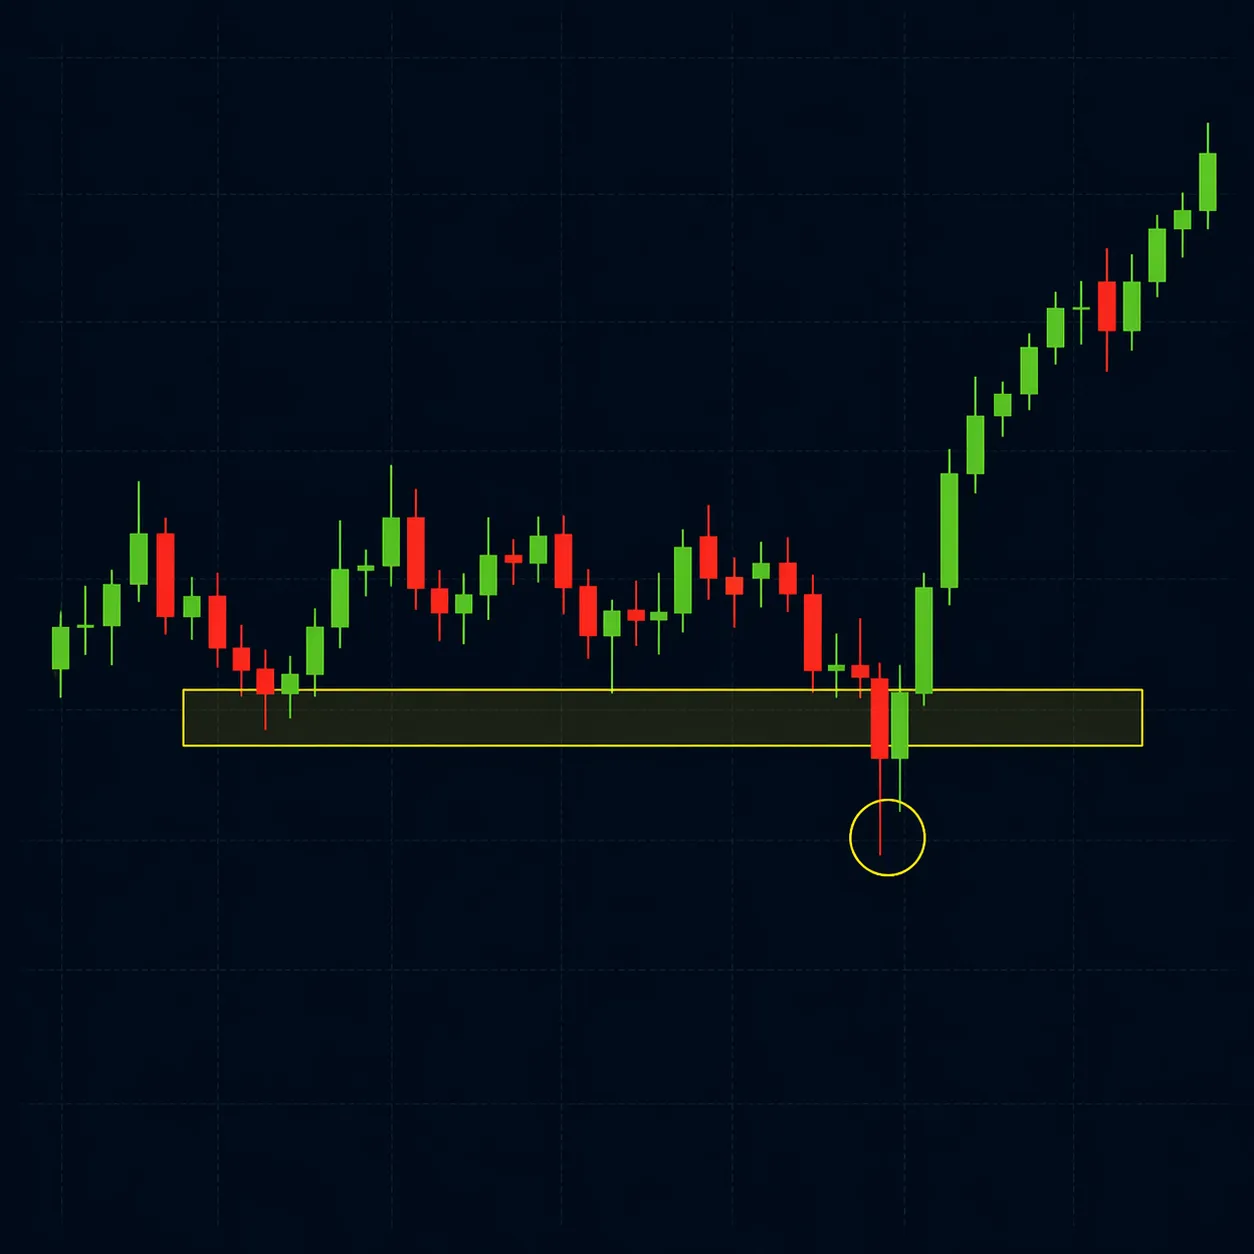
Price pulls back to sweep liquidity below the previous high and retests the broken structure.
This is where the smart money enters.
Volume
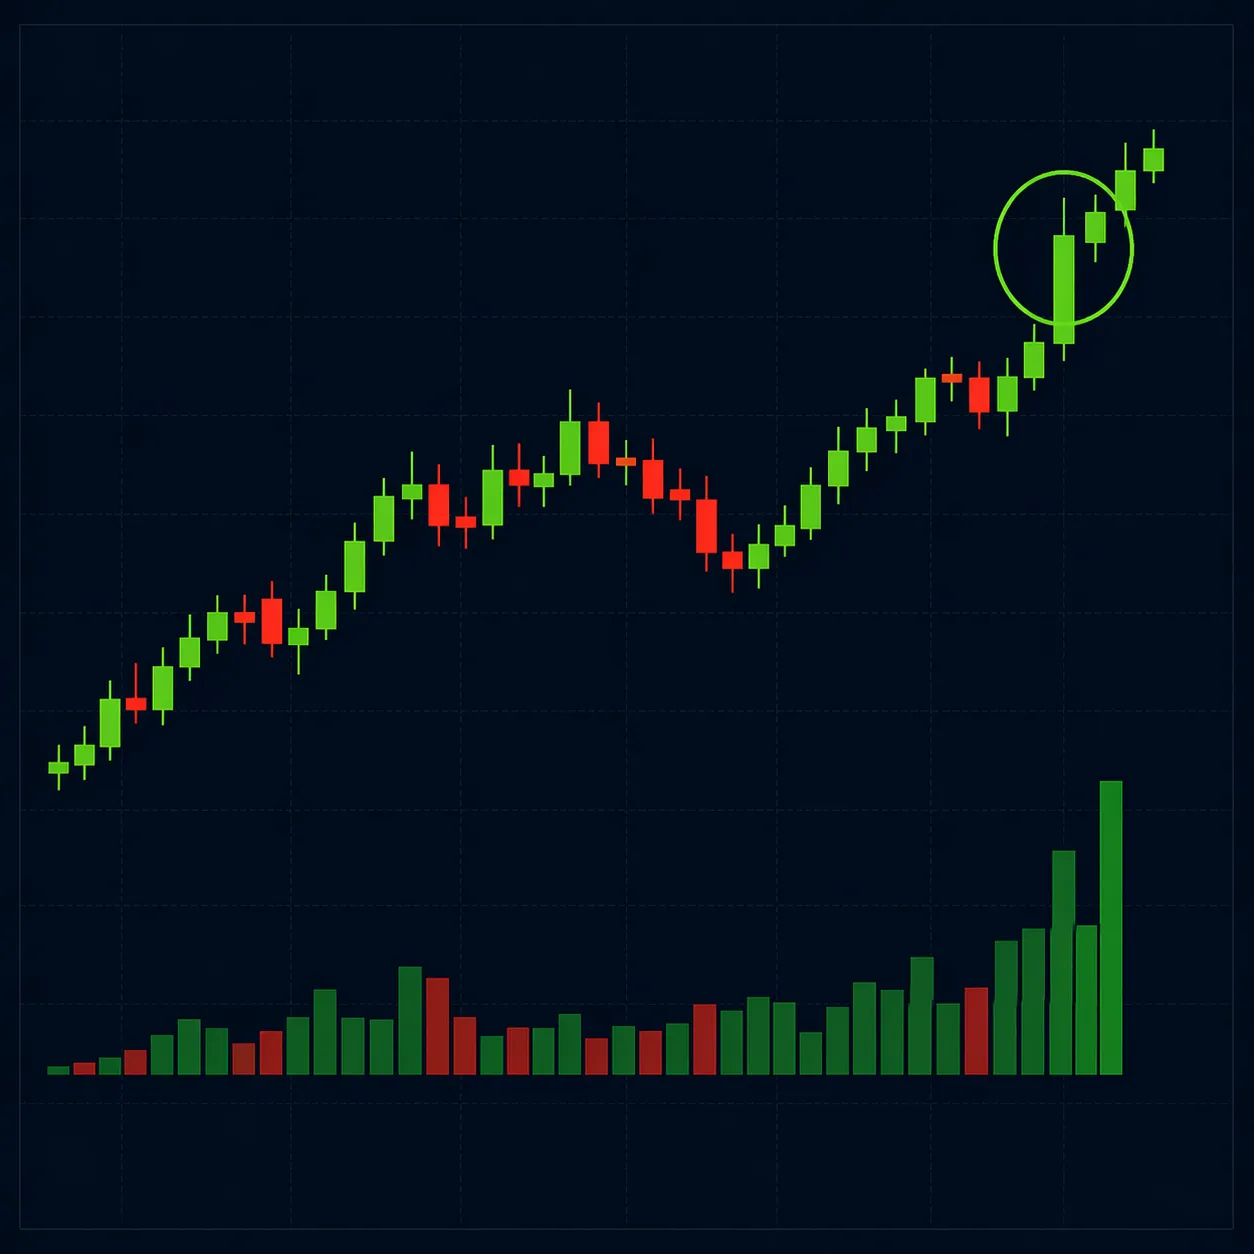
Strong bullish candle with high volume confirms buyer strength.
Now the trade is in motion.
Time & Context
Price reaches the target at the next key resistance level.
Clean execution. Plan followed.
Don’t just look at good trades — study them, journal them, and learn how to find them yourself.